|
In 2005, there were approximately 9,174,648 jobs in U.S. industries that consume steel, as compared to 150,534 jobs in U.S. industries that produce steel, or 61 steel-consuming jobs for every 1 steel-producing job.
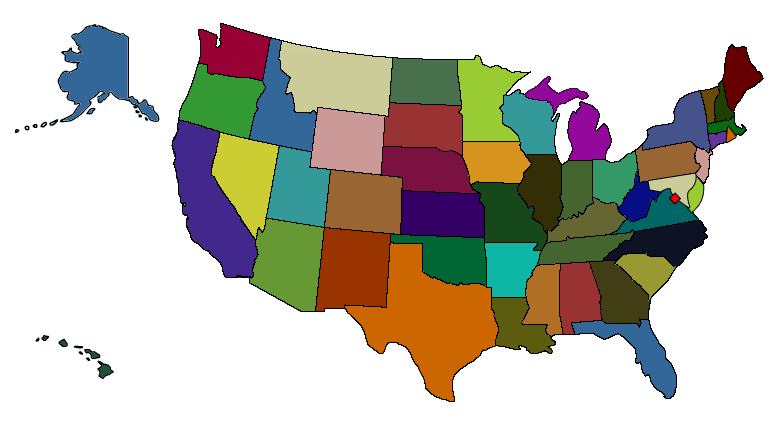
The state-by-state and Congressional District breakdown provided in this interactive map was prepared by Economic Consulting Services, LLC for the CITAC Steel Task Force. The data was compiled from U.S. Department of Labor, Bureau of Labor Statistics; and the U. S. Department of Commerce, Bureau of the Census.
Steel-consuming employment is based on the share of the workforce devoted to steel consumption in the following sectors: Building construction, heavy and civil engineering construction, and building foundation and exterior contractors (NAICS codes 236, 237 and 2381); Oil and gas extraction (NAICS code 211); Tire manufacturing (NAICS code 3262); Foundries (NAICS code 3315); Fabricated metal product manufacturing (NAICS code 332); Machinery manufacturing (NAICS code 333); Electrical equipment and appliance manufacturing (NAICS code 335); and Transportation equipment manufacturing (NAICS code 336).
Steel-producing employment is based on the share of the workforce devoted to steel production in the following sectors: Iron and steel mills and ferroalloy manufacturing (NAICS code 3311); and Steel product manufacturing from purchased steel (NAICS code 3312).
|